在OS X下进行的环境搭建,配置如下:
1
2
3
4
5
6
7
8
9
10
11
12
13
### User: pims #### Hostname: PimsdeMacBook-Pro ### Distro: OS X 10.15.3 ####### ####### Kernel: Darwin ###################### Uptime: 7:32 ##################### Shell: /bin/zsh #################### Terminal: xterm-256color iTerm.app #################### CPU: Intel Core i5-8257U CPU @ 1.40GHz ##################### Memory: 16 GB ###################### Disk: 26% #################### Battery: 100% ################ #### #####
由于官网提供的补丁版qemu在本地报错make不成功,所以用的是正常版的qemu,但是对于在完成exercise的过程中没有遇到很大的问题,对于lab文件的make结果如下:
1
2
3
4
5
6
7
8
9
10
11
12
13
14
15
16
17
18
➜ lab git:(lab1) ✗ make + as kern/entry.S + cc kern/entrypgdir.c + cc kern/init.c + cc kern/console.c + cc kern/monitor.c + cc kern/printf.c + cc kern/kdebug.c + cc lib/printfmt.c + cc lib/readline.c + cc lib/string.c + ld obj/kern/kernel i386-jos-elf-ld: warning: section `.bss' type changed to PROGBITS + as boot/boot.S + cc -Os boot/main.c + ld boot/boot boot block is 382 bytes (max 510) + mk obj/kern/kernel.img
内容为阅读汇编的文档,进行了阅读,了解了内嵌汇编的语法格式。
逐步执行查看了运行过程,并且对于GDB指令进行了进一步的熟悉。
At what point does the processor start executing 32-bit code? What exactly causes the switch from 16- to 32-bit mode?
1
2
3
4
5
6
7
8
lgdt gdtdesc movl %cr0, %eax orl $CR0_PE_ON, %eax movl %eax, %cr0 # Jump to next instruction, but in 32-bit code segment. # Switches processor into 32-bit mode. ljmp $PROT_MODE_CSEG, $protcseg
在修改完了cr0的值之后,通过ljmp指令切换到32-bit模式
What is the last instruction of the boot loader executed, and what is the first instruction of the kernel it just loaded?
在main.c文件中可以看到,bootmain结尾的最后是:
1 ((void (*)(void )) (ELFHDR->e_entry))();
转到ELF头里面的入口,这个函数正常情况下不会返回,所以后面bad里面的死循环在正常情况下是永远不可能执行的代码。
在obj/boot/boot.asm里面可以看到对应的内容为:
1 7d63: ff 15 18 00 01 00 call *0x10018
Where is the first instruction of the kernel?
在gdb窗口中b *0x7d63在call语句前面打一个断点,之后执行si,可以看到kernel里面的第一条语句是
1 0x10000c: movw $0x1234,0x472
How does the boot loader decide how many sectors it must read in order to fetch the entire kernel from disk? Where does it find this information?
在ELF头里面,保存了相关的信息,其中Elf数据类型的定义inc/elf.h头文件当中:
1
2
3
4
5
6
7
8
9
10
11
12
13
14
15
16
17
struct Elf { uint32_t e_magic; uint8_t e_elf[12 ]; uint16_t e_type; uint16_t e_machine; uint32_t e_version; uint32_t e_entry; uint32_t e_phoff; uint32_t e_shoff; uint32_t e_flags; uint16_t e_ehsize; uint16_t e_phentsize; uint16_t e_phnum; uint16_t e_shentsize; uint16_t e_shnum; uint16_t e_shstrndx; };
其中e_phoff表示Program header table在文件中的偏移量,e_phnum表示Program header table里面一共有多少个条目,在bootmain的主函数中从ELF头读入得到:
1
2
ph = (struct Proghdr *) ((uint8_t *) ELFHDR + ELFHDR->e_phoff); eph = ph + ELFHDR->e_phnum;
pointers.c的文件具体内容如下:
1 2 3 4 5 6 7 8 9 10 11 12 13 14 15 16 17 18 19 20 21 22 23 24 25 26 27 28 29 30 31 32 33 34 35 36 37 38 39 40 41 42 43 44 45 46 47 #include <stdio.h> #include <stdlib.h> void f (void ) { int a[4 ]; int *b = malloc (16 ); int *c; int i; printf ("1: a = %p, b = %p, c = %p\n" , a, b, c); c = a; for (i = 0 ; i < 4 ; i++) a[i] = 100 + i; c[0 ] = 200 ; printf ("2: a[0] = %d, a[1] = %d, a[2] = %d, a[3] = %d\n" , a[0 ], a[1 ], a[2 ], a[3 ]); c[1 ] = 300 ; *(c + 2 ) = 301 ; 3 [c] = 302 ; printf ("3: a[0] = %d, a[1] = %d, a[2] = %d, a[3] = %d\n" , a[0 ], a[1 ], a[2 ], a[3 ]); c = c + 1 ; *c = 400 ; printf ("4: a[0] = %d, a[1] = %d, a[2] = %d, a[3] = %d\n" , a[0 ], a[1 ], a[2 ], a[3 ]); c = (int *) ((char *) c + 1 ); *c = 500 ; printf ("5: a[0] = %d, a[1] = %d, a[2] = %d, a[3] = %d\n" , a[0 ], a[1 ], a[2 ], a[3 ]); b = (int *) a + 1 ; c = (int *) ((char *) a + 1 ); printf ("6: a = %p, b = %p, c = %p\n" , a, b, c); } int main (int ac, char **av) { f(); return 0 ; }
得到的输出结果为:
1
2
3
4
5
6
1: a = 0x7ffeef413940, b = 0x7ffe70c00060, c = 0x7ffeef4139a0 2: a[0] = 200, a[1] = 101, a[2] = 102, a[3] = 103 3: a[0] = 200, a[1] = 300, a[2] = 301, a[3] = 302 4: a[0] = 200, a[1] = 400, a[2] = 301, a[3] = 302 5: a[0] = 200, a[1] = 128144, a[2] = 256, a[3] = 302 6: a = 0x7ffeef413940, b = 0x7ffeef413944, c = 0x7ffeef413941
可以看到b指向的是在堆上面开辟的空间,而a、c都是在栈上面开辟的空间,所以地址存在一定差异。之后都是一些比较简单的地址索引以及指针加法。
这里将boot/Makefrag文件中的0x7C00修改成了0x7D00:
1
2
3
4
5
6
$(OBJDIR)/boot/boot: $(BOOT_OBJS) @echo + ld boot/boot $(V)$(LD) $(LDFLAGS) -N -e start -Ttext 0x7D00 -o $@.out $^ $(V)$(OBJDUMP) -S $@.out >$@.asm $(V)$(OBJCOPY) -S -O binary -j .text $@.out $@ $(V)perl boot/sign.pl $(OBJDIR)/boot/boot
重新make之后,查看obj/boot/boot.asm可以发现链接地址已经发生了改变:
1
2
3
4
5
6
7
8
9
10
11
12
13
14
15
16
17
.globl start start: .code16 # Assemble for 16-bit mode cli # Disable interrupts 7d00: fa cli cld # String operations increment 7d01: fc cld # Set up the important data segment registers (DS, ES, SS). xorw %ax,%ax # Segment number zero 7d02: 31 c0 xor %eax,%eax movw %ax,%ds # -> Data Segment 7d04: 8e d8 mov %eax,%ds movw %ax,%es # -> Extra Segment 7d06: 8e c0 mov %eax,%es movw %ax,%ss # -> Stack Segment 7d08: 8e d0 mov %eax,%ss
但是执行GDB可以看到,事实上BIOS依然将boot loader加载到了0x7c00的位置,也就是说程序在执行到这里的时候,前面依然有一部分是可以正常执行的:
1
2
3
4
5
6
7
8
9
10
11
12
13
14
15
16
17
18
19
20
21
22
23
24
25
26
27
28
29
30
31
32
33
34
35
36
37
38
39
40
41
42
Breakpoint 1, 0x00007c00 in ?? () (gdb) x/40i 0x7c01: cld 0x7c02: xor %eax,%eax 0x7c04: mov %eax,%ds 0x7c06: mov %eax,%es 0x7c08: mov %eax,%ss 0x7c0a: in $0x64,%al 0x7c0c: test $0x2,%al 0x7c0e: jne 0x7c0a 0x7c10: mov $0xd1,%al 0x7c12: out %al,$0x64 0x7c14: in $0x64,%al 0x7c16: test $0x2,%al 0x7c18: jne 0x7c14 0x7c1a: mov $0xdf,%al 0x7c1c: out %al,$0x60 0x7c1e: lgdtl (%esi) 0x7c21: fs jge 0x7c33 0x7c24: and %al,%al 0x7c26: or $0x1,%ax 0x7c2a: mov %eax,%cr0 0x7c2d: ljmp $0xb866,$0x87d32 0x7c34: adc %al,(%eax) 0x7c36: mov %eax,%ds 0x7c38: mov %eax,%es 0x7c3a: mov %eax,%fs 0x7c3c: mov %eax,%gs 0x7c3e: mov %eax,%ss 0x7c40: mov $0x7d00,%esp 0x7c45: call 0x7d0b 0x7c4a: jmp 0x7c4a 0x7c4c: add %al,(%eax) 0x7c4e: add %al,(%eax) 0x7c50: add %al,(%eax) 0x7c52: add %al,(%eax) 0x7c54: (bad) 0x7c55: incl (%eax) 0x7c57: add %al,(%eax) 0x7c59: lcall $0x0,$0xffff00cf 0x7c60: add %dl,0x1700cf(%edx) 0x7c66: dec %esp
但是与之前相比而言,对于ljmp指令发生了改变,这里附上之前的内容:
1
2
3
4
5
6
7
8
9
10
11
12
13
14
15
16
17
18
19
20
21
22
23
24
25
26
27
28
29
30
31
32
33
34
35
36
37
38
39
40
41
42
Breakpoint 1, 0x00007c00 in ?? () (gdb) x/40i 0x7c01: cld 0x7c02: xor %eax,%eax 0x7c04: mov %eax,%ds 0x7c06: mov %eax,%es 0x7c08: mov %eax,%ss 0x7c0a: in $0x64,%al 0x7c0c: test $0x2,%al 0x7c0e: jne 0x7c0a 0x7c10: mov $0xd1,%al 0x7c12: out %al,$0x64 0x7c14: in $0x64,%al 0x7c16: test $0x2,%al 0x7c18: jne 0x7c14 0x7c1a: mov $0xdf,%al 0x7c1c: out %al,$0x60 0x7c1e: lgdtl (%esi) 0x7c21: fs jl 0x7c33 0x7c24: and %al,%al 0x7c26: or $0x1,%ax 0x7c2a: mov %eax,%cr0 0x7c2d: ljmp $0xb866,$0x87c32 0x7c34: adc %al,(%eax) 0x7c36: mov %eax,%ds 0x7c38: mov %eax,%es 0x7c3a: mov %eax,%fs 0x7c3c: mov %eax,%gs 0x7c3e: mov %eax,%ss 0x7c40: mov $0x7c00,%esp 0x7c45: call 0x7d0b 0x7c4a: jmp 0x7c4a 0x7c4c: add %al,(%eax) 0x7c4e: add %al,(%eax) 0x7c50: add %al,(%eax) 0x7c52: add %al,(%eax) 0x7c54: (bad) 0x7c55: incl (%eax) 0x7c57: add %al,(%eax) 0x7c59: lcall $0x0,$0xffff00cf 0x7c60: add %dl,0x1700cf(%edx) 0x7c66: dec %esp
可以看到由$0x87c32变成了$0x87d32,在执行完了ljmp指令之后,程序就会出错了。
在0x7c00处添加断点,查看0x100000地址存放的内容,可以发现是全0,这就是BIOS在进入boot loader的时候,对应的内容。
1
2
0x100000: 0x00000000 0x00000000 0x00000000 0x00000000 0x100010: 0x00000000 0x00000000 0x00000000 0x00000000
之后再0x7d63处添加断点,此时是boot loader要进入内核的时点,0x100000存放的内容如下:
1
2
0x100000: 0x1badb002 0x00000000 0xe4524ffe 0x7205c766 0x100010: 0x34000004 0x7000b812 0x220f0011 0xc0200fd8
可以发现已经发生了改变,并不是一开始的全0,说明boot loader进行了一个载入内核的工作。
从entry.S中,可以看到mov %eax,%cr0位于入口的开头处,利用gdb在入口处设置断点,逐条执行可以发现,这条指令位于0x100025,在此处设置断点:
1
2
3
4
5
6
(gdb) x/8x 0x00100000 0x100000: 0x1badb002 0x00000000 0xe4524ffe 0x7205c766 0x100010: 0x34000004 0x7000b812 0x220f0011 0xc0200fd8 (gdb) x/8x 0xf0100000 0xf0100000 <_start-268435468>: 0x00000000 0x00000000 0x00000000 0x00000000 0xf0100010 <entry+4>: 0x00000000 0x00000000 0x00000000 0x00000000
执行完这条指令之后:
1
2
3
4
5
6
(gdb) x/8x 0x00100000 0x100000: 0x1badb002 0x00000000 0xe4524ffe 0x7205c766 0x100010: 0x34000004 0x7000b812 0x220f0011 0xc0200fd8 (gdb) x/8x 0xf0100000 0xf0100000 <_start-268435468>: 0x1badb002 0x00000000 0xe4524ffe 0x7205c766 0xf0100010 <entry+4>: 0x34000004 0x7000b812 0x220f0011 0xc0200fd8
可以发现,在执行这条指令之前,0xf0100000处是全0的,在执行之后,有了和0x00100000处一样的值。设置了%cr0后启用分页,让0xf0100000和0x00100000映射到了同样的物理地址,所以查看会有相同的值。
在entry.S中可以看到,之后他尝试执行的指令是:
1
2
mov $relocated, %eax jmp *%eax
他要在执行C代码之前,跳转到KERNBASE上方,不再在低地址了。从gdb可以发现,这里移入%eax的值为0xf010002f,如果没有启用分页,那么跳转将会失败。
可以发现当注释掉那一行之后,会导致内核崩溃,卡在Booting from Hard Disk..,同时利用GDB查看也可以看到,跳转进入的0xf010002c位置为全0。
缺失的内容定义在printfmt.c中第206行,直接仿照上面的%u进行修改,将base改成8就可以了。
1 2 3 4 5 6 case 'o' : num = getuint(&ap, lflag); base = 8 ; goto number;
可以发现,修改完之后,命令行中的"6828 decimal is 15254 octal!"已经可以正确显示了。
Explain the interface between printf.c and console.c. Specifically, what function does console.c export? How is this function used by printf.c?
console.c里面cputchar()函数在printf.c里面被使用了。它的作用是往屏幕上打印一个字符,被用在printf.c里面的putch()函数中,之后作为参数传入vprintfmt()的调用过程。
Explain the following from console.c:
1
2
3
4
5
6
7
if (crt_pos >= CRT_SIZE) { int i; memmove(crt_buf, crt_buf + CRT_COLS, (CRT_SIZE - CRT_COLS) * sizeof (uint16_t )); for (i = CRT_SIZE - CRT_COLS; i < CRT_SIZE; i++) crt_buf[i] = 0x0700 | ' ' ; crt_pos -= CRT_COLS; }
CRT_SIZE指的应该是crt_buff里面显示缓冲区的大小,所以这里的情况实际是超过缓冲区最大上限的时候的处理方法。memmove()函数的定义如下所示,其作用是将str2处复制n个字符到str1处,在有重叠区域的情况下比memcpy()更加安全。
1 void *memmove (void *str1, const void *str2, size_t n)
所以这里所进行的内容是将缓冲区的内容整体前移了CRT_COLS字符,腾出了一部分的缓冲区空间。
For the following questions you might wish to consult the notes for Lecture 2. These notes cover GCC’s calling convention on the x86.
1
2
int x = 1 , y = 3 , z = 4 ;cprintf("x %d, y %x, z %d\n" , x, y, z);
In the call to cprintf(), to what does fmt point? To what does ap point?
List (in order of execution) each call to cons_putc, va_arg, and vcprintf. For cons_putc, list its argument as well. For va_arg, list what ap points to before and after the call. For vcprintf list the values of its two arguments.
在对于cprintf()的调用当中,fmt指的是格式化的字符串,ap指向的是参数列表。
其中cons_putc()的内容如下:
1 2 3 4 5 6 7 8 static void cons_putc (int c) { serial_putc(c); lpt_putc(c); cga_putc(c); }
他的作用是向console输出一个字符,主要的操作位于cga_putc()内容当中,对于输入来确定字符,然后根据情况进行输出。
vcprintf()内容如下:
1
2
3
4
5
6
7
8
int vcprintf (const char *fmt, va_list ap) { int cnt = 0 ; vprintfmt((void *)putch, &cnt, fmt, ap); return cnt; }
传入格式化的字符串以及对应的参数列表,然后通过调用vprintfmt()进行输出。
而va_arg()的调用在vprintfmt()当中出现,例如:
1
2
3
case '*' : precision = va_arg(ap, int ); goto process_precision;
他实现的内容实际上是从ap里面读取一个参数,然后将ap进行一个修改,即通过后面提供的数据类型来进行指针的移动。
这三个函数的关系是vcprintf()中调用了vprintfmt(),在vprintfmt()内部利用va_arg()对格式化字符串中的参数进行解析,之后得到确切的字符串利用cons_putc()函数一个一个字符的向console进行输出。
Run the following code.
1
2
unsigned int i = 0x00646c72 ;cprintf("H%x Wo%s" , 57616 , &i);
What is the output? Explain how this output is arrived at in the step-by-step manner of the previous exercise.
The output depends on that fact that the x86 is little-endian. If the x86 were instead big-endian what would you set i to in order to yield the same output? Would you need to change 57616 to a different value?
得到的输出为:“He110 World”。
可以知道57616转换成16进制的结果为e110,所以前半部分得到的是He110。
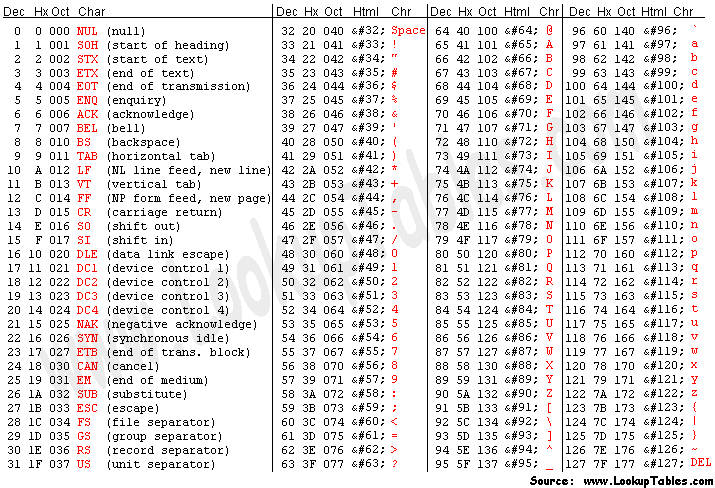
后半部分对应ASCII码表可以知道:
由于小端法存储,0x00646c72的存储实际上是
对应的字符串就是"rld\0",得到的后半部分为World。
如果改为大端法,对前半部分不会有影响,后半部分需要改成i = 0x726c6400。
In the following code, what is going to be printed after ‘y=’? (note: the answer is not a specific value.) Why does this happen?
1 cprintf("x=%d y=%d" , 3 );
执行得到的结果为"x=3 y=-267288596",因为此处y所对应的%d没有给出,那么他会尝试在栈上读取内容。通过gdb调试可以知道最后传入时候ap = f0117fd4
1
2
3
(gdb) x/8x 0xf0117fd4 0xf0117fd4: 0x00000003 0xf0117fec 0x00000000 0x00000000 0xf0117fe4: 0x00000000 0x00000000 0x00646c72 0x00000000
查看地址所对应的内容,可以发现所打印出来的y其实就是后面的0xf0117fec转换成int的值。
Let’s say that GCC changed its calling convention so that it pushed arguments on the stack in declaration order, so that the last argument is pushed last. How would you have to change cprintf or its interface so that it would still be possible to pass it a variable number of arguments?
需要能够从栈顶知道一共有多少参数才能规范后面的行为,通过调整参数顺序,把fmt字符串当做最后一个参数输入,或者添加一个新参数为参数的总个数n放在末尾都可以。
在kern/entry.S的末尾可以看到如下代码,在.data段里面为栈预留了KSTKSIZE大小的空间。
1
2
3
4
5
6
7
8
9
10
.data ################################################################### # boot stack ################################################################### .p2align PGSHIFT # force page alignment .globl bootstack bootstack: .space KSTKSIZE .globl bootstacktop bootstacktop:
在obj/kern/kernel.asm中的第56-58行,通过设置%esp来初始化栈的位置。
1
2
3
# Set the stack pointer movl $(bootstacktop),%esp f0100034: bc 00 80 11 f0 mov $0xf0118000,%esp
栈底的位置就是0xf0118000,从高地址往低地址生长。
同时在kern/entry.S的69行处可以看到:
1
2
3
4
5
6
relocated: # Clear the frame pointer register (EBP) # so that once we get into debugging C code, # stack backtraces will be terminated properly. movl $0x0,%ebp # nuke frame pointer
将栈的终点设置为0,这能够使得后面进行的backtrace可以正常终止,不会陷入死循环或者出错访问到栈之外的空间。
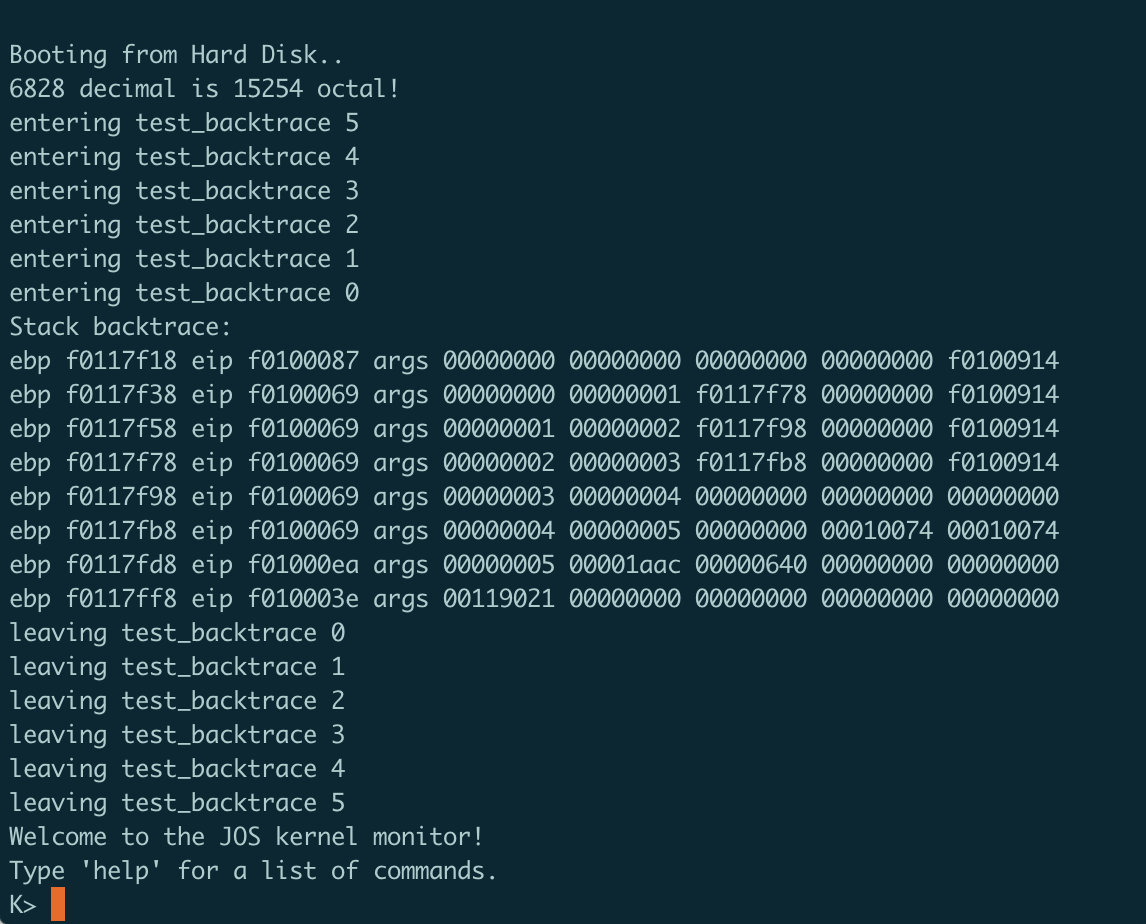
流程就是不断进行函数的调用,输入的参数每一次都-1,从一开始的5到最后的1然后到达递归终点。
obj/kern/kernel.asm中的对应内容如下:
1
2
3
4
5
6
7
8
9
10
11
12
13
14
15
16
17
18
19
20
21
22
23
24
25
26
27
28
29
30
31
32
33
34
35
36
37
void test_backtrace(int x) { f0100040: 55 push %ebp f0100041: 89 e5 mov %esp,%ebp f0100043: 53 push %ebx f0100044: 83 ec 14 sub $0x14,%esp f0100047: 8b 5d 08 mov 0x8(%ebp),%ebx cprintf("entering test_backtrace %d\n", x); f010004a: 89 5c 24 04 mov %ebx,0x4(%esp) f010004e: c7 04 24 80 18 10 f0 movl $0xf0101880,(%esp) f0100055: e8 34 09 00 00 call f010098e <cprintf> if (x > 0) f010005a: 85 db test %ebx,%ebx f010005c: 7e 0d jle f010006b <test_backtrace+0x2b> test_backtrace(x-1); f010005e: 8d 43 ff lea -0x1(%ebx),%eax f0100061: 89 04 24 mov %eax,(%esp) f0100064: e8 d7 ff ff ff call f0100040 <test_backtrace> f0100069: eb 1c jmp f0100087 <test_backtrace+0x47> else mon_backtrace(0, 0, 0); f010006b: c7 44 24 08 00 00 00 movl $0x0,0x8(%esp) f0100072: 00 f0100073: c7 44 24 04 00 00 00 movl $0x0,0x4(%esp) f010007a: 00 f010007b: c7 04 24 00 00 00 00 movl $0x0,(%esp) f0100082: e8 cb 06 00 00 call f0100752 <mon_backtrace> cprintf("leaving test_backtrace %d\n", x); f0100087: 89 5c 24 04 mov %ebx,0x4(%esp) f010008b: c7 04 24 9c 18 10 f0 movl $0xf010189c,(%esp) f0100092: e8 f7 08 00 00 call f010098e <cprintf> } f0100097: 83 c4 14 add $0x14,%esp f010009a: 5b pop %ebx f010009b: 5d pop %ebp f010009c: c3 ret
通过:
1 f0100044: 83 ec 14 sub $0x14,%esp
可以看到,每次栈向下生长0x14,并且每一次函数调用都会传入参数,同时保存%ebp和%ebx的值,将其压入栈中。每次栈向下生长0x20。折算成32-bit字的话应当是8个。
补全的mon_backtrace()如下:
1
2
3
4
5
6
7
8
9
10
11
12
13
14
15
16
17
int mon_backtrace (int argc, char **argv, struct Trapframe *tf) { cprintf("Stack backtrace:\n" ); uint32_t * ebp = (uint32_t *)read_ebp(); while (ebp){ cprintf("ebp %08x " ,ebp); cprintf("eip %08x " ,*(ebp+1 )); cprintf("args" ); int i; for (i=2 ;i<=6 ;++i) cprintf(" %08x" ,*(ebp+i)); cprintf("\n" ); ebp = (uint32_t *)(*ebp); } return 0 ; }
执行结果如下:
可以看到最顶上的是mon_backtrace()函数,下面是五次的test_backtrace()调用,符合题目要求。
在debuginfo_eip()中利用stab_binsearch()函数来查找行号,通过观察inc/stab.h中的宏定义可以发现对应的类型应当是N_SLINE,对于搜索得到的结果,将行号从stabs数组中提取填写到info里面。如果lline>rline说明出现了错误,直接返回-1。
1
2
3
4
5
stab_binsearch(stabs, &lline, &rline, N_SLINE, addr); if (lline <= rline) info->eip_line = stabs[lline].n_desc; else return -1 ;
之后修改mon_backtrace()函数内部如下:
1
2
3
4
5
6
7
8
9
10
11
12
13
14
15
16
17
18
19
20
21
22
int mon_backtrace (int argc, char **argv, struct Trapframe *tf) { cprintf("Stack backtrace:\n" ); uint32_t * ebp = (uint32_t *)read_ebp(); struct Eipdebuginfo info ; while (ebp){ cprintf("ebp %08x " ,ebp); cprintf("eip %08x " ,ebp[1 ]); cprintf("args" ); int i; for (i=2 ;i<=6 ;++i) cprintf(" %08x" ,ebp[i]); cprintf("\n" ); debuginfo_eip(ebp[1 ], &info); cprintf("\t%s:%d: %.*s+%d\n" , info.eip_file, info.eip_line, info.eip_fn_namelen, info.eip_fn_name, ebp[1 ]-info.eip_fn_addr); ebp = (uint32_t *)(*ebp); } return 0 ; }
在kern/monitor.c文件中加入新的命令行指令,这样当输入backtrace的时候就会调用mon_backtrace()函数。
1
2
3
4
5
static struct Command commands [] = { "help" , "Display this list of commands" , mon_help }, { "kerninfo" , "Display information about the kernel" , mon_kerninfo }, { "backtrace" , "Findout the the value of \%ebp, \%eip and the args of called functions" , mon_backtrace}, };
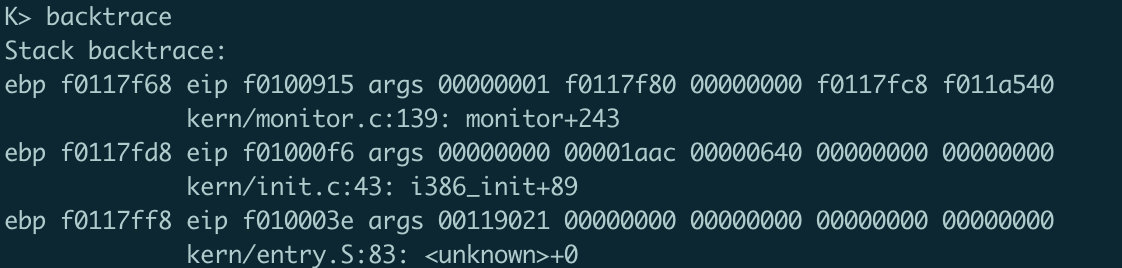
执行结果如下:
可见该指令可以成功被调用。
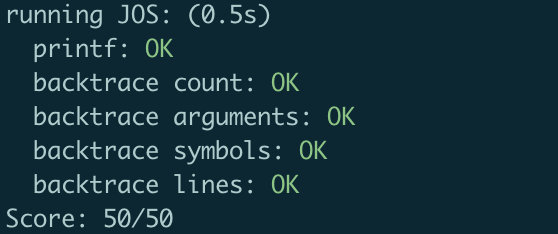
在本地使用make grade评测可以得到满分50分:
通过WIKI百科 中对于ANSI escape code的描述可以知道,利用\e[可以开启一个控制序列,那么只需要调整在输出字符串的开头控制颜色,在结尾恢复就可以,例如以下代码就会将输出文本调整成红色:
1 \e[31m<output string>\e[0m
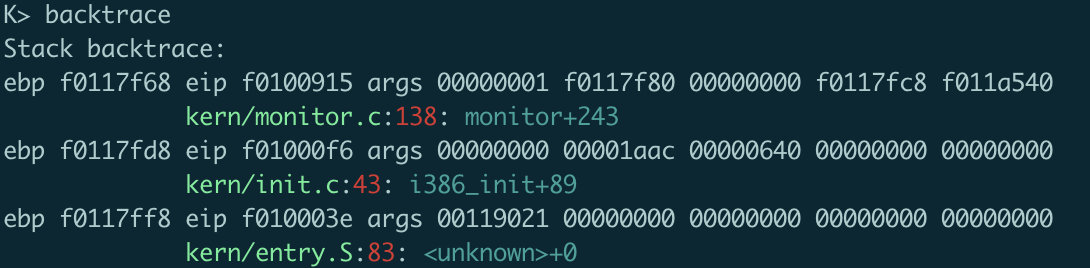
将mon_backtrace()中打印行号等部分修改如下:
1 cprintf("\t\e[92m%s\e[0m:\e[31m%d\e[0m: \e[36m%.*s+%d\e[0m\n" , info.eip_file, info.eip_line, info.eip_fn_namelen, info.eip_fn_name, ebp[1 ]-info.eip_fn_addr);
可以看到产生图中所示的彩色输出: